Writing a WordPress plugin is inspiration, perspiration, testing, guess work, and frustration. You spend hours making your plugin just right, but you never know if it is just right. You hear from some of the happy users and none of the unhappy ones. This guess work leads to assumptions we can’t back up.
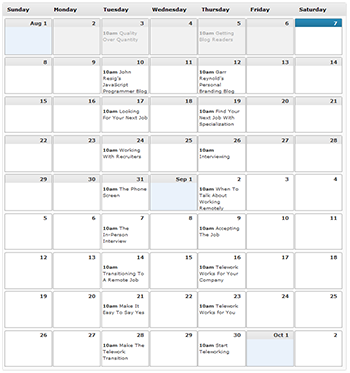
The team from Stresslimit Design and I have been working on the WordPress Editorial Calendar for months, but we have no real idea how people use it. How many weeks are people looking at in the calendar? How big are there screens? How many posts do they have per day? We need the answers to design the plugin, but we’re just fumbling through the dark.
With version 0.9 of the calendar we’re trying to turn on the light.
Why we’re collecting data
WordPress plugins go out into the wild and don’t phone home. You get a simple plugin statistics page, but never find out who’s using your plugin, how they’re using it, or even if they installed it after downloading. As a privacy nut I like that, but it makes my life as a designer difficult.

The editorial calendar is getting close to version 1.0 and we’re trying to refine our interface. Make those little tweaks that take it from good to great. We started with a simple question, how many weeks should we show on the calendar by default? I rarely post more than once a day and my 24-inch monitor stretches on like the Montana prairie so I want as many weeks as possible. I could even go up to eight or nine.
Nine weeks is the perfect answer for me, but it isn’t the right answer. Most users are stuck in Manhattan apartment sized screens and can’t see nine weeks with a magnifying glass. Well… that’s what I think, but I don’t really know. If I had real data on people’s window sizes I could make the right choice and make the calendar that much better.
That’s why we’re tracking data with this plugin. To make it work better. That’s most of the reason. We also want to know how many people are really using it.
Always make it opt-in
WordPress plugins have a gigantic amount of power. They can delete your data, steal your passwords, and hack your blog. When you install a plugin you’re saying I trust this plugin to not be evil. That’s a lot of trust and the Editorial Calendar has to earn it.
We could collect data automatically, but that’s evil. Instead we make all data collection opt-in. Users can very clearly see everything we collect and have to click the button before we collect anything.

How it works
The data collection is based on Mint. I already used Mint to track statistics for my own site. Mint is a more configurable and better looking competitor to Google Analytics. It also lets me hold onto my data instead of sending it to Google.
Normally Mint is part of your website with a simple declaration like <script src="/mint/?js" type="text/javascript"></script>. This causes the Mint JavaScript to get downloaded, collect information about the browser, and call back to the server without visitors ever knowing.
Source Code
This type of website data collection is ubiquitous. Every major site does it and the total volume of personal information they collect is a little scary. My privacy rant is coming up in a little while.
Mint made collecting data from the Editorial Calendar pretty easy. It just takes a few lines of JavaScript to get Mint onto the Calendar page:
jQuery.getScript('http://www.zackgrossbart.com/edcal/mint/?js', function() {
    edcal.saveFeedbackPref();
});
|
Now I can dynamically load the mint JavaScript files and save the preference of that when it’s done. The dynamic loading is important because I don’t want to collect data every time and automatic data collection is way too scary. Right now we prompt the user to let us collect data after they’ve loaded the calendar three times, and we never collect any data until we get permission.
Peppers
Mint collects data about how people came to your site like who they were referred by and what terms they searched for to get there. It also collects information about the environment like what browser they’re running and if they have Flash. I needed data more specific to the calendar like how many weeks are people seeing and how many posts do they have per day. For that I needed to write a Pepper.
Peppers are the way you extend the capabilities of Mint. I love puns. They’re written in PHP and JavaScript and collect or display extra data. There are Peppers to tell you how big someone’s browser window is or who has a secret crush on your website. My Pepper collects data about the calendar.
This Pepper is open source and like the rest of the code on this blog it is released under the Apache License, Version 2.0. That means you can copy it, change it, or use it for free.
Setting up our Pepper
The Editorial Calendar Stats Pepper starts with a PHP file called class.php and a big comment.
<?php /************************************************** Pepper Developer : Zack Grossbart Plug-in Name : Edcal Stats **************************************************/ $installPepper = "SI_EdcalStats"; class SI_EdcalStats extends Pepper { var $version = 1; // Displays as 0.01 var $info = array ( 'pepperName' => 'Editorial Calendar Stats', 'pepperUrl' => 'http://www.zackgrossbart.com', 'pepperDesc' => 'Editorial Calendar Pepper', 'developerName' => 'Zack Grossbart', 'developerUrl' => 'http://www.zackgrossbart.com' ); |
The $info array sets up our Pepper and gives us the basics; a title and description. With this class we define the functionality and feel of the Pepper using a special set of variables. We start by defining the panes we’ll show on the statistics page.
Defining our panes
var $panes = array
(
    'Editorial Calendar Stats' => array
    (
        'Stats'
    )
);
|
The Editorial Calendar Stats Pepper just has one pane where it shows the Stats for the calendar plugin. This makes our $panes array very simple.
Collecting data
The next step is to define the data we want to collect and where we’ll store it in the database.
var $manifest = array1 ( 'visit' => array ( 'edcal_weeks' => "SMALLINT(5) NOT NULL DEFAULT '-1'", 'edcal_posts' => "SMALLINT(5) NOT NULL DEFAULT '-1'", 'edcal_author' => "TINYINT" ) ); function onRecord() { $edcalWeeks = $this->Mint->escapeSQL($_GET['edcal_weeks']);2 $edcalPosts = $this->Mint->escapeSQL($_GET['edcal_posts']); $edcalAuthor = $this->Mint->escapeSQL($_GET['edcal_author']); return array ( 'edcal_weeks' => (float) $edcalWeeks, 'edcal_posts' => (float) $edcalPosts, 'edcal_author' => (boolean) $edcalAuthor ); } |
The $manifest array1 defines the database columns we need. Mint will create these database columns when this Pepper is installed. We need columns for the number of visible weeks, the number of posts, and if they are showing authors.
We populate these fields with the onRecord function. The values come on the URL so we access the data using the PHP $_GET function2.
Querying the calendar with JavaScript
function onJavaScript()
{
    $js = "pepper/zackgrossbart/edcalstats/script.js"1;
    if (file_exists($js))
    {
        include_once($js);
    }
}
|
We access configuration values in the calendar using JavaScript. We tell Mint about our JavaScript file with the onJavaScript function1. This adds the script.js file to our Mint request.
Mint.SI.EdcalStats =
{
    onsave  : function()
    {
        if (edcal) {

            /*
             * Collect the number of weeks they are showing
             */
            var val = '&edcal_weeks=' + edcal.weeksPref;1


            /*
             * If they are showing authors
             */
            if (edcal.authorPref) {2
                val += '&edcal_author=1';
            } else {
                val += '&edcal_author=0';
            }

            /*
             * Get the average number of posts they have
             * per day
             */
            var dayCounts = [];

            jQuery("#cal_cont .dayobj > .postlist").each(function() {
                /*
                 * Don't consider days with zero posts
                 */
                if (jQuery(this).children().length > 0) {
                    dayCounts.push(jQuery(this).children().length);3
                }
            });

            var total = 0;
            for (var i = 0; i < dayCounts.length; i++) {
                total += dayCounts[i];
            }

            if (dayCounts.length > 0) {
                val += '&edcal_posts=' + Math.round(total / dayCounts.length);
            } else {
                val += '&edcal_posts=0';
            }

            return val;

        }
    }
};
|
The Editorial Calendar is already running in our JavaScript memory space so calling it from script.js is ideal. We can call the existing functions to collect the data we need. The current number of weeks1, the authors preference2, and the average number of posts per day3. JQuery makes it easy to iterate over the DOM.
Showing the data
Now that we’ve collected all of this data we need to show it on the Editorial Calendar Statistics page. For that we’ll implement the onDisplay function
function onDisplay($pane, $tab, $column = '', $sort = '')
{
$html = '';
    switch($pane)
    {
        case 'Editorial Calendar Stats':
        $html  = '<table cellspacing="0" class="two-edcal-columns">';
        $html .= "\r\t<tr>\r";
        $html .= "\t\t<td style=\"padding-right: 4px;\" class=\"left\">\r";
        $html .= $this->getHTML_EdcalWeeks();
        $html .= "\t\t</td>";
        $html .= "\t\t<td class=\"right\">\r";
        $html .= $this->getHTML_EdcalPosts();
        $html .= "<br />";
        $html .= $this->getHTML_EdcalAuthor();
        $html .= "\t\t</td>";
        $html .= "\r\t</tr>\r";
        $html .= "</table>\r";
        break;
    }

    return $html;
}
|
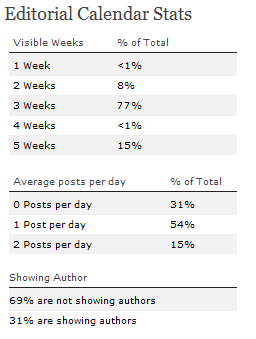
We show a little table for each piece of data we’ve collected and define the contents of that table in separate functions.
What about privacy?
Stats Page
There is a constant tension between collecting data and preserving privacy. I know we’re only using this data to improve the plugin, but would I trust a group of strangers to use the data? Maybe.
This article is a how to, but it’s also about transparency. I want to make it clear what data we’re collecting and how we’re using it.
We went out of our way to make sure the data collected by the calendar is innocuous and non-commercial. We don’t sell the data. Honestly, nobody would want to buy it.
The whole point is to make the calendar better. The more we understand how it’s being used the better we can make the design. The calendar should be simple and easy to use, but simple isn’t so simple. Making something that feels good means we have to know how people use it and what feels good to them. These statistics help us do just that.

